Posts

Showing posts from July, 2017
Image
Day 20: Analysing the effect of Oxygen glucose deprivation on C17.2 cells upon the treatment of peptides TAT, Myr-p110, and TAT-p110   Aim: to assess the affect of OGD on C17.2 cells after 1.5 hours and 3 hours by assaying LDH, Hoechst and MTT. Reason for assaying LDH: LDH is lactate dehydrogenase which catalyses the conversion of pyruvate -> lactate during anaerobic respiration. Anaerobic respiration only involves the process of glycolysis which occurs only in the cytosol. Thus, if the peptides became cytotoxic to the cells, then the lactate dehydrogenase would leak out into the medium and therefore be detectable by increased absorbance and less transmission. Reason for assaying Hoechst: Hoechst specifically stains nuclei blue. If there are more nuclei present this means that less cells have died as a result of cytotoxicity. If there are less nuclei present this means that more cells have died as a result of cytotoxicity. It is required that we make a blank and then a trea
Image
Day 19: oxygen glucose deprivation experiment on C17.2 cells - I labelledup the plates with either Control, 1.5 hr OGD or 3 hr OGD. - Obtain the 1.5hr plate and the 3hr plate and aspirate the media from them. Wash each well out with 500µl of PBS and aspirate that out as well to ensure that there is no more media left in the wells. - place 500µl of the artificial CSF in both the 1.5 and 3 hour plates. - I took both plates and place them into separate hypoxia chambers. Start with the 1.5hr plate. Flood the chamber with nitrogen for one minute and clasp the tubes shut when complete. - Place the chamber back into the incubator and set the timer for 90 minutes. - Obtain the 3 hour plate and place it into the other hypoxia chamber. Also flood this chamber with nitrogen for one minute, clasp the clips shut and place it into the incubator. Set the timer for 3 hours. - while the oxygen glucose deprivation is happening, prepare the peptides as follows: Dilution of the peptides for
Image
Day 18: LDH, Hoechst and MTT assays to assess the cytotoxicity of TAT, Myr-p110 and TAT-P110 from 0µM – 10µM Aim: to assess the cytotoxicity of varying concentrations of the peptides TAT, Myr-p110 and TAT-p110 by assaying LDH, Hoechst and MTT with DMSO Reason for assaying LDH: LDH is lactate dehydrogenase which catalyses the conversion of pyruvate -> lactate during anaerobic respiration. Anaerobic respiration only involves the process of glycolysis which occurs only in the cytosol. Thus, if the peptides became cytotoxic to the cells, then the lactate dehydrogenase would leak out into the medium and therefore be detectable by increased absorbance and less transmission of UV. Reason for assaying Hoechst: Hoechst specifically stains nuclei blue. If there are more nuclei present this means that less cells have died as a result of cytotoxicity. If there are less nuclei present this means that more cells have died as a result of cytotoxicity. It is required that we make a
Image
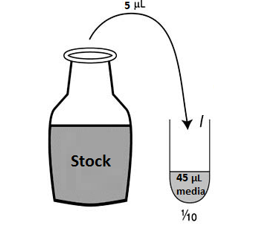
Day 17: Treating C17 cells with p110 peptide                        It was required that we diluted the stock solutions which were available to us to make up the desired concentrations for the wells: 0.1μM, 0.3μM, 1μM, 3μM, 10μM.   The TAT and Myr-p110 were both 10mM stock solutions whilst TAT-p110 was 4mM stock solution as it would not dissolve properly previously. The desired final concentrations meant that we had to dilute the stock solution into 1/10 and 1/100 solutions: -           Put 45 μl media into each of the tubes – the aim is to have 50 μl total volume by the end of the dilution. -           Take 5μl TAT Stock 10mM and place it into the 1/10 TAT tube. Vortex to ensure that the stock has dissolved properly. -           Take 5μl from 1/10 TAT and place it into the 1/100 TAT tube, also vortex to ensure the mixture is properly diluted. -           Repeat these steps for the Myr-p110 and the TAT-p110.        The overall volumes required:

Week 4: Inhibiting mitochondrial fission using p110 peptide varients in an attempt to prolong cell survival during neonatal hypoxic ischaemia

Image
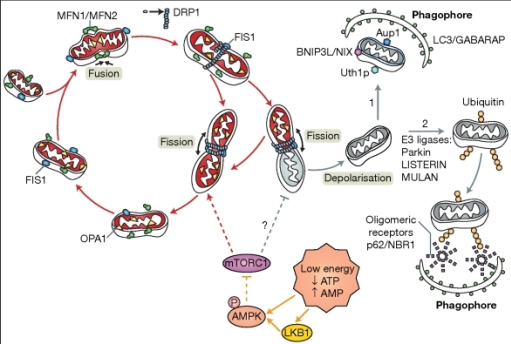
The theory behind the experiment: - There is an increase in mitochondrial mitophagy during neonatal hypoxic ischaemia. The cell becomes stressed as a result of the reduced oxygen in the environment. Reactive oxygen species (ROS) being formed after electrons react with molecular oxygen in the electron transport chain. The mitochondria which have become damaged will undergo the process of mitochondrial fission, mediated by the proteins Drp1, MFF, MID49/51 and Fis1. The mitochondria which have accumulated damage will have their damaged features taken to just one area in the mitochondrion. Once fission has occurred and one mitochondrion has become two, the mitochondrion which had accumulated its damage will undergo mitochondrial mitophagy. - As a result, less ATP is available for the cell but more ROS is produced. In addition, the mitochondrial membrane also becomes leaky releasing apoptosis stimulating factors and cytochrome c, therefore stimulating apoptosis and exaggerating th
Day 15: Simply splitting cells I split cells from the two flasks that I left incubating last week and combined them into two flasks but with different media. One flask contained the media that I had previously used before doing my own oxygen glucose deprivation experiments while the other contained a different medium. On Monday (day 16) I will compare the confluence of the cells in both flasks and hopefully will be conducting more cell culture experiments next week!
Image
Day 14: Visualising Parkin and LC3B on western blot from p9 mice samples at 0 hours after 70 minute hypoxic ischaemia Result for Parkin: Parkin was visible at 52 kDa on the contralateral and ipsilateral lanes. The bands were more intense on the contralateral lanes which indicates that after 0 hours, there is not much recruitment of Parkin to the mitochondria for subsequent mitophagy. Result for LC3B: LC3B bands seemed to be at approximately equal levels in each lanes, but the mitochondrial lanes (last two lanes) are slightly brighter and this is most likely because the LC3B is starting to get recruited to auto phagosome and undergoing mitophagy.
Image
Day 13: Visualising PINK1 and LC3B, and running a western blot on 0 hour hypoxic ischaemic p9 mice samples The results for PINK1 and LC3B: PINK1 and LC3B seemed to be observed more in the 24 hour lanes (last 4 lanes) than in the 4 hours lanes. This is understandable, as cells which underwent oxygen glucose deprivation for a longer period of time would be under more stress and consequently more mitochondrial mitophagy would occur in those cells. Running a western blot on p9 mice cell samples at 0 hours after hypoxic ischaemia for 70 minutes: I had previously tested for mitochondrial mitophagy quality control proteins on p9 mice samples at 2 hours and 24 hours, thus we needed to test for changes in the proteins at 0 hours. We decided to test for the presence of Parkin and LC3B. I followed the same western blot procedure that I had conducted before and left the membrane at 4 degrees in the cold room with the primary antibodies for visualisation after secondary ant
Image
Day 12: Calculating protein concentrations and running a western blot The set up of the experiment: C17 cell lysates were made by placing 2 12 well plates in cell culture. One cell culture was placed in a hypoxia chamber for four hours while the other was for 24 hours with their respective controls in a different plate. 2 μl of the sample was diluted with 38 μl distilled water. 10 μl of each sample was placed in duplicate wells on a 96 well plate with 90 μl of diluted BioRad into each well. Along with the samples, standard control solutions were also set up, from 0 – 200. These were important to standardise the data and calculate the absorbance of each sample, subsequently allowing us to calculate the concentration of protein in each sample as well as the volume needed of each when running the western blot. The 96 well plate was placed into a special promega machine that would calculate the absorbance of each sample. The concentrations of the protein samples can be seen

Week 3

Image
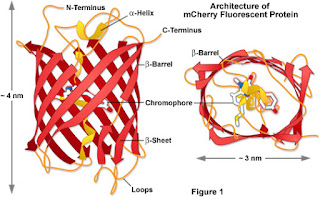
Day 11: Splitting cells, my first mistake and calculating protein concentrations I managed to split the C17 cells on my own and unassisted from two previously split flasks. The aim was to keep the spare cells for oxygen glucose deprivation experiments and transfections with mCherry. What is mCherry? mCherry is a special flurophore which is used in molecular biology techinques as a tracer to track the localisation of molecules or organelles. In this case, we wanted to use it to view mitochondria. Unlike Keima or JC1 which I previously had experience with, mCherry would simply flurorece bright red once it was localised to mitochondria in the cells. The structure of mCherry: The structure of mCherry is such that it is a beta barrel motif with a fluorophore which is attached on the gap of the beta barrel. In addition there is also an alpha helix which runs down the beta barrel stabilising the chromophore in the centre. The theory behind using Cherry with relation to
Day 10: Harvesting cells The cells that were used previously needed to be harvested for next week. We harvested them by using a cell lysis buffer made of Triton X1000 and Hepes. I scraped as many cells as possible from the plates in solution with the lysis buffer and placed them in the freezer. Next week we will be examining the proteins from these cells. Exciting!
Image
Day 9: Oxygen/glucose deprivation to C. 17 cells We wanted to observe the effect of oxygen glucose deprivation on the C 17 cells. The way in which we did this was by immersing the cells in artificial cerebrospinal fluid. The artificial cerebrospinal fluid did not contain any glucose and treated it with a vaccum to ensure that there was no oxygen in the fluid. we incubated two plates for 1 hour and a half and another two for 3 hours by placing it in a hypoxia chamber and flooding the chamber with nitrogen. The result on the control plates: The control cells did not under go oxygen glucose deprivation. The top photo shows the neurones with no marker dyes whilst the bottom shows that they were treated with markers JC1 and Hoechst. Hoechst stains the nuclei and chromatin. JC1 is a special fluorescent dye that changes colour depending on membrane potential. When the mitochondrial membrane potential is high, JC1 is aggregated and fluoresces red. However when the mitochondrial mem
Image
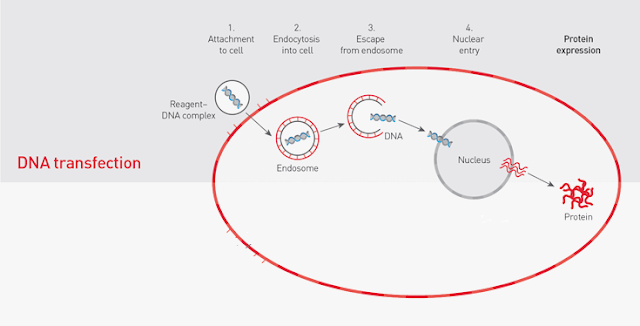
Day 8: Transfecting the C.17 cells We decided to transfect the C.17 cells with lipofectamine 2000, which is a lipid rich mixture containing lipid micelles that a capable of transporting genetic information extra cellularly to the intracellular environment. The lipid micelles contain hydrophilic heads and hydrophobic tails that can fuse with the C. 17 cells. The liposome has a cationic exterior and is able to attract the overall partial negative charge on the cDNA of the plasmid. Once inside, the liposome releases the plasmid which is taken up into the nucleus, where it is transcribed into its corresponding mRNA transcript. After post translational modification, the mRNA transcript is translated to the protein product: Keima. What is Keima? Keima is a special coral derived acid stable fluorescent protein which can fluoresce different colours depending on the pH that it is exposed to. The Keima cDNA is ligated into a plasmid with a mitochondrial tag a
Image
Day 7: Splitting Cells After incubating the cells over night, we had to see if they were confluent enough to split. We did this by simply looking down the microscope and observing them. This is me observing the cells that we had incubated over night. Although there was not  significant amount of confluence we still decided to work on the cells and split them to create a new passage. What is a passage? A passage is when cells from one culture is transferred into a fresh growth medium. This may also be referred to as subculturing or passaging the cells. The purpose of this process is that it has the purpose of expanding the number of cells or microorganisms in the culture. The cell line we worked with was passage 13, so once we split them they would have been called passage 14, meaning that we had to label up new flasks. We incubated them again so we could work on transfecting them for the next day... At the same time: We decided to run a western blot for Mitofusin-1 an

Week 2

Image
Day 6: Splitting Cells! I was very excited for what this week had in store for me! After being exposed to a substantial amount of western blotting the previous week, I was very excited to understand the principles of cell culture and how scientists utilise cell lines as part of their research. When entering the room where visualising and examining cells takes place, the importance of maintaining a sterile environment became apparent to me. We had to change our lab coats and obtain new gloves which needed to be sprayed with 70% ethanol. Obtaining the cells: The cells that we used needed to be stored in liquid nitrogen as they were an immortal neuronal cell line (C. 17) from mice. Thus, keeping them in liquid nitrogen is a cryogenic method in which its life cycle is frozen in time and can only proceed once it has been defrosted. Here is a photo of my supervisor obtaining the cells from their box. It looked pretty dramatic! Once we defrosted the cells, we carefully pour