Day 12: Calculating protein concentrations and running a western blot
The set up of the experiment:
C17 cell lysates were made by placing 2 12 well plates in cell culture. One cell culture was placed in a hypoxia chamber for four hours while the other was for 24 hours with their respective controls in a different plate. 2 μl of the sample was diluted with 38 μl distilled water. 10 μl of each sample was placed in duplicate wells on a 96 well plate with 90 μl of diluted BioRad into each well. Along with the samples, standard control solutions were also set up, from 0 – 200. These were important to standardise the data and calculate the absorbance of each sample, subsequently allowing us to calculate the concentration of protein in each sample as well as the volume needed of each when running the western blot.

The 96 well plate was placed into a special promega machine that would calculate the absorbance of each sample.
 The data collected could be uploaded to Excel for further processing such as normalising the data, making a standard curve for calculating concentrations and obtaining the R squared value and gradient of the line. I could then choose the samples that had the highest concentrations to run a western blot. The samples were chosen on which had the highest protein content.
The set up of the experiment:
C17 cell lysates were made by placing 2 12 well plates in cell culture. One cell culture was placed in a hypoxia chamber for four hours while the other was for 24 hours with their respective controls in a different plate. 2 μl of the sample was diluted with 38 μl distilled water. 10 μl of each sample was placed in duplicate wells on a 96 well plate with 90 μl of diluted BioRad into each well. Along with the samples, standard control solutions were also set up, from 0 – 200. These were important to standardise the data and calculate the absorbance of each sample, subsequently allowing us to calculate the concentration of protein in each sample as well as the volume needed of each when running the western blot.
The 96 well plate was placed into a special promega machine that would calculate the absorbance of each sample.
 |
The concentrations of the protein samples can be seen on screen
|
The standard curve:

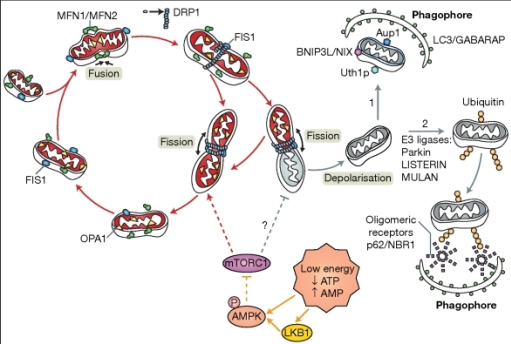
After the volumes were calculated to run the blot. The desired proteins that we wanted to look for were mitchodnrial mitophagy quality control proteins PINK1 and LC3B. Once the PVDF membrane was treated with the primary antibodies relating to the proteins, they were left for 24 hours at 4degrees in a cold room.

Comments
Post a Comment