Day 18:
LDH, Hoechst and MTT assays to assess the cytotoxicity of TAT, Myr-p110 and TAT-P110 from 0µM – 10µM


LDH, Hoechst and MTT assays to assess the cytotoxicity of TAT, Myr-p110 and TAT-P110 from 0µM – 10µM
Aim: to assess the cytotoxicity of varying concentrations of
the peptides TAT, Myr-p110 and TAT-p110 by assaying LDH, Hoechst and MTT with
DMSO
Reason for assaying LDH: LDH is lactate dehydrogenase which
catalyses the conversion of pyruvate -> lactate during anaerobic
respiration. Anaerobic respiration only involves the process of glycolysis
which occurs only in the cytosol. Thus, if the peptides became cytotoxic to the
cells, then the lactate dehydrogenase would leak out into the medium and
therefore be detectable by increased absorbance and less transmission of UV.
Reason for assaying Hoechst: Hoechst specifically stains
nuclei blue. If there are more nuclei present this means that less cells have
died as a result of cytotoxicity. If there are less nuclei present this means
that more cells have died as a result of cytotoxicity. It is required that we
make a blank and then a treated plate with MTT and DMSO to observe the
difference in cytotoxicity of the peptides.
Reason for assaying MTT: The MTT assay is a colorimetric
assay for assessing cell metabolic activity. NAD(P)H-dependent cellular
oxidoreductase enzymes may, under defined conditions, reflect the number of
viable cells present. These enzymes
are capable of reducing the tetrazolium dye MTT to its insoluble formazan,
which has a purple color.
The LDH assay:
- There are 3 24 well plates and thus there were 72 wells in
total.
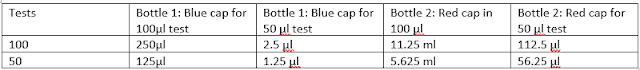
- 50 μl samples are required for each well. The type of LDH assay conducted was the LDH Roche assay and this has two different bottes: red cap and blue cap. Therefore a total of 3.2 ml reagent is need ie (50μl x 70)
- 50 μl samples are required for each well. The type of LDH assay conducted was the LDH Roche assay and this has two different bottes: red cap and blue cap. Therefore a total of 3.2 ml reagent is need ie (50μl x 70)

Explanation: we want for 50 μl instead of 100 μl, therefore
we need to divide the values by 100 to see how much we need for 1 . For the ml
values, multiply by 1000 first before dividing by 100 to get the value into μl.
Example: for 250 μl, divide by 100 to make 2.5 μl.
Example 2: for 11.25 ml, multiply by 1000 to get 11250 μl hen divide by 100 to make 112.5 μl.
Example 2: for 11.25 ml, multiply by 1000 to get 11250 μl hen divide by 100 to make 112.5 μl.
Therefore the the LDH assay: 2.5 μl of blue cap bottle and
112.5 μl of the red cap bottle for a 50 μl test instead of 100 μl PER 1x 50 μl
TEST.
There are 72 wells in total, but scale up to 80 wells to
ensure to account for pipetting errors, therefore:
For the bottle 1 blue cap: 80 x 1.25 μl = 100 μl
For the bottle 2 red cap: 80 x 56.25 μl = 4.5 ml
For the bottle 2 red cap: 80 x 56.25 μl = 4.5 ml
- Prepare these volumes and place it into a 15 ml falcon
tube and put it in ice.
- obtain a 96 well plate and label by the following:


The cytotoxicity of TAT and TAT-p110 follows the trend of as their concentrations are increased, the absorbance of LDH is also increased being indicative of a higher cytotoxicity. Myr-p110, appears to have its highest cytotoxicity at 1micromolar and the absorbance of LDH appears to decrease again.
Working out the significance of the data:
Peptide – low control/high control – low control x 100 = % cytotoxicity. The high control is the well containing the lysis buffer and the low control is the average of the other 3 wells that contain just media on the 0 column.
Peptide – low control/high control – low control x 100 = % cytotoxicity. The high control is the well containing the lysis buffer and the low control is the average of the other 3 wells that contain just media on the 0 column.
The Hoechst Assay: This was calculated by adding 50 μl Hoechst to all 3 24 well plates and obtaining a "blank" reading and a real reading of the number of nuclei stained in each well. I took the average as there were 4 repeats for each concentration, and simply found the difference between the treatement and the "blank" reading.
Result:


It appears that TAT-p110 seemed to be most cytotoxic at all concentrations whilst cell survival in the wells containing TAT and Myr-p110 was similar.
MTT assay:
I added 40 μl MTT, found in the freezer to each of the wells
excluding the high control, ie the lysed cells. When the MTT is added, the
media should turn a brown colour and I left this in the incubator for 30 minutes. After 30 minutes I aspirated out the MTT and added 200μl of DMSO to release all of the cellular contents and make the lysate turn a purple colour.

Results:

At all the peptide concentrations, TAT seemed to indicate mitochondrial function the most, despite the fact that it was only a control, whilst Myr-p110 and TAT-p110 gradually decreased mitochondrial function as their respective concentrations increased.

Comments
Post a Comment